Reduction with hydrogen – Ellingham diagram
Download the colorful InsPyro Ellingham diagram with H2/H2O axis here (download pdf).
Due to the need for decarbonization in the manufacturing industry, hydrogen comes into the picture as a potential green alternative. Not only to replace fossil-fueled energy, but also as a reductant in metallurgical processes. Successful metal-making largely depends on the art of controlling the oxidation and reduction reactions. Practically all processes use a carbon source to control the reduction extent. The principle is rather simple, carbon binds with oxygen (from metal oxide) and leaves the process as CO or CO2 gas. When carbon is replaced with hydrogen the principle remains the same. Hydrogen binds with oxygen (from metal oxide) and leaves the process as H2O. Although the principle is rather straightforward, it is important to understand that thermodynamic boundaries limit the usage of carbon/hydrogen.
The main tool for studying oxidation/reduction is an Ellingham diagram. In this diagram, the stability of different metals and their oxides are compared. Every line in the diagram represents the oxidation of a metal to a metal oxide. The vertical axis gives the Gibbs energy of the oxidation reaction. The more negative the Gibbs energy is (= the lower the line in the diagram), the more stable the oxide becomes.
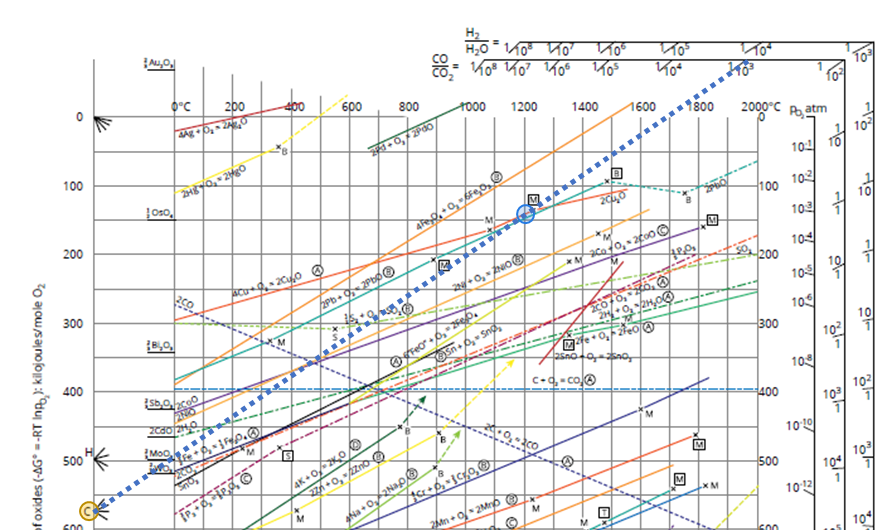
In industry, the CO/CO2 ratio is often used to indicate if a process is in a reducing or oxidizing state. The higher the ratio (higher CO or lower CO2) the more reducing the atmosphere is. If you are interested to know which CO/CO2 ratio leads to a reduction of your metal, you can use the Ellingham diagram. Let us take copper as an example in a process at 1200°C:
- Illustrated in Figure 1
- Find the 4Cu + O2 -> 2 Cu2O line (orange line in the upper part of the diagram)
- Connect the C point on the left (orange circle), with the point 1200°C on the 4Cu + O2 -> 2 Cu2O line (blue circle)
- Extend this to the CO/CO2 scale (dotted line).
- Here you read CO/CO2=1/10³ or CO/CO2=10-3. If the ratio is larger Cu2O will reduce to Cu metal, if the ratio is smaller Cu will oxidize to Cu2O.
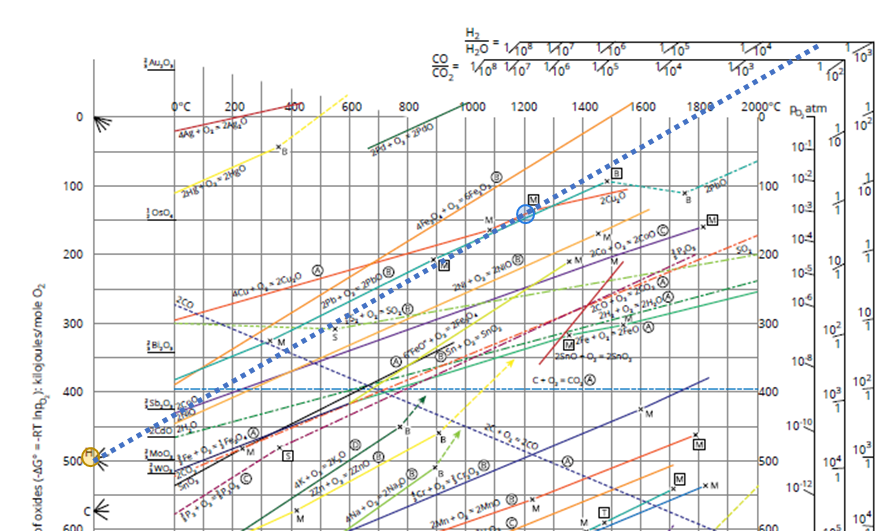
For H2 a similar reasoning can be made. The reduction potential will depend on the H2/H2O ratio in the atmosphere of the process. The higher the ratio, the more reducing the gas. In the Ellingham diagram, this can be read as follows (Cu example again):
- Illustrated in Figure 2
- Find the 4Cu + O2 -> 2 Cu2O line (orange line in the upper part of the diagram)
- Connect the H point on the left (orange circle), with the point 1200°C on the 4Cu + O2 -> 2 Cu2O line (blue circle)
- Extend this to the H2/H2O scale (dotted line).
- Here you read H2/H2O =5/104 or H2/H2O =5*10-4. If the ratio is larger Cu2O will reduce to Cu metal, if the ratio is smaller Cu will oxidize to Cu2O.
When comparing the reduction potential of hydrogen to carbon, it is important to see that CO is a product from carbon. As long as carbon is present in the process, the CO/CO2 ratio is kept low. H2 use for reduction immediately impacts the atmosphere conditions and the reduction potential can not be maintained. The full working principle of an Ellingham diagram is explained in our thermodynamic training program (www.inspyro.be/training).
Download the colorful InsPyro Ellingham diagram with H2/H2O axis here (download pdf).